First Resources Limited, is an
investment holding company, which engages in the cultivation and
maintenance of oil palm plantations primarily in Singapore and
Indonesia. It operates in two segments, Plantations and Palm Oil
Mills, and Refinery and Processing. It is also involved in harvesting
and milling the fresh fruit bunches into crude palm oil (CPO) and
palm kernel products, and also process CPO and palm kernel into value
palm-based products, such as bio-diesel, refined, bleached and
deodorized (RBD) olein, RBD stearin, palm kernel oil, and palm kernel
expeller. It engages in oil palm seed breeding and rubber plantation
activities; and marketing and selling processed palm based products.
First Resources manages approximately 190,000 hectares of oil palm
plantations, and operates 12palm oil mills in Indonesia. Apart from
this, it owns and manages air-crafts. The Company exports its
products. It was found in 1992 and is based in Singapore. It is a
subsidiary of Eight Capital Inc.
It operates in two segments, Plantations and Palm Oil
Mills, and Refinery and Processing. It is also involved in harvesting
and milling the fresh fruit bunches into crude palm oil (CPO) and
palm kernel products, and also process CPO and palm kernel into value
palm-based products, such as bio-diesel, refined, bleached and
deodorized (RBD) olein, RBD stearin, palm kernel oil, and palm kernel
expeller. It engages in oil palm seed breeding and rubber plantation
activities; and marketing and selling processed palm based products.
First Resources manages approximately 190,000 hectares of oil palm
plantations, and operates 12palm oil mills in Indonesia. Apart from
this, it owns and manages air-crafts. The Company exports its
products. It was found in 1992 and is based in Singapore. It is a
subsidiary of Eight Capital Inc.|
Return on Equity |
14.45% |
|
Net Asset Value |
SGD 1076.859 |
|
Market Cap |
SGD 3065.2 MN |
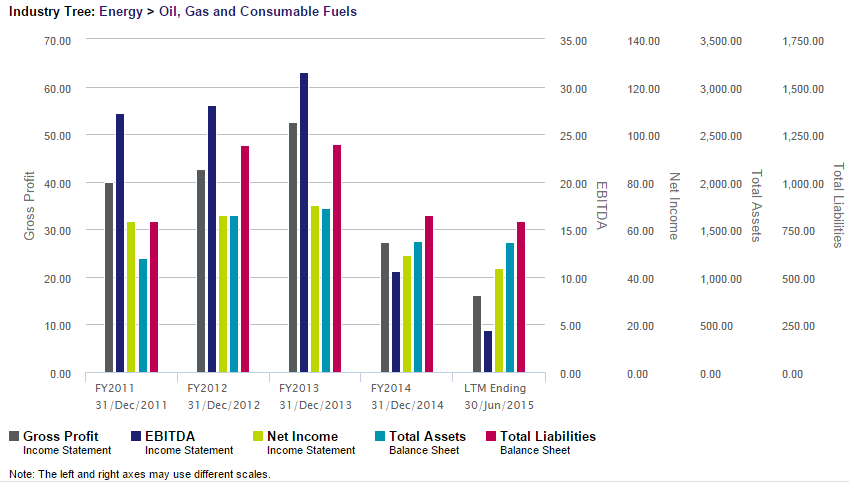
FINANCIAL VIEW
- The ratio of asset and liability is increasing as y-o-y figures are considered.
- The net income and Gross profit are not that much reliable, however for short term investment it can be ignored.
|
|
FY2013
31Dec 13 |
FY2014
31Dec 14 |
LTM Ending
30 Jun 15 |
|
Revenue |
626.429 |
615.524 |
533.898 |
|
Gross Profit |
381.743 |
323.399 |
306.68 |
|
Net Income |
238.242 |
173.409 |
156.103 |
|
EBITDA |
337.126 |
297.665 |
283.69 |
|
Total Assets |
1780.274 |
1997.855 |
1957.131 |
|
Total Liabilities |
740.149 |
882.105 |
880.272 |
GROWTH OVER PRIOR YEAR (%)
TECHNICAL INDICATORS:
Daily Chart: It is a major
uptrend counter and has recently taken a lot of correction is
downtrend, now it has started showing up the bullish signal by giving
a breakout on the trend line and on OBV. Also, RSI is too low now,
which means an oversold condition and thus stock is likely to
increase now.
|
SGX Symbol |
EB5 |
Currency |
SGD |
|
Last Done |
1.555 |
Volume(‘000) |
1127.3 |
|
Day’s Range |
1.52-1.56 |
52 Weeks’ Range |
1.435-2.19 |
Weekly Chart: Weekly chart will
also show the bullish signals if it goes above 1.60 and thus give a
clear breakout on the trend line as well as the OBV.
|
S1 |
S2 |
R1 |
R2 |
|
1.515 |
1.435 |
1.60 |
1.725 |
Our VIEW:
Overall Trend: Overall trend
seems to be positive with some minor corrections, if any.
Short term View: BULLISH above 1.60 with support @ 1.515.
Short term View: BULLISH above 1.60 with support @ 1.515.
Long term View: BULLISH above
1.725 with support @ 1.60.