GOLD
Gold remained unchanged overnight to
open at 1309.00/1310.00. It dropped to a five-week low of
1305.00/1306.00 on expectations of an earlier-than-expected rise in
U.S. interest rates underpinned by U.S. data that pointed to a
strong gain in consumer confidence while new home sales came in on
expectations.

The metal then climbed to a high of 1315.50/1316.50 on
technical buying amidst speculation of potential economic sanctions
by the West on Russia over the ongoing Ukrainian crisis. It closed
the day flat at 1310.00/1311.00.
Gold found some stability today,
closing at 1311, and right around a big technical level at 1312.
This is the 38.2% retracement of the 2014 rally. Support is at 1296,
the 200-day-moving average. If gold breaks that level we expect
there will be stop-loss sellers. Resistance is at yesterday’s high
in the 1334 area.
Gold ended with losses as expectations
of higher U.S. interest rates and a lack of physical buying weighed
on prices.
U.S. consumer confidence surged to a
six-year high in March and house prices increased solidly in January,
positioning the economy for stronger growth
SPDR gold trust holding dropped by 2.70
tonnes i.e. 0.33% to 818.77 tonnes from 821.47 tonnes.
SILVER
Silver too remained relatively
unchanged overnight, opening the session at 19.98/20.03. It dipped
to a low of 19.91/19.96 before following gold to a high of
20.14/20.19. It concluded the session at 19.96/20.01.

Silver closed slightly lower today at
19.96 after yesterday’s steep drop. The technical outlook looks
bearish, and we expect a test of support at the base in the 18.83
level. Resistance is at yesterday’s high of 20.31.
The gold-silver ratio made a small gain
today, trading at 65.65. There is strong support at the uptrend at
62.95. Closer by, there is support at 65.02, the 76.4% retracement
of the drop from 67.47 to 57.09. RSI has diverged, and has not made
a new high to confirm the new high in the ratio. As noted yesterday,
while the uptrend is .still intact, we may see some near-term
weakness in the ratio.
Silver dropped as pressure seen after
stronger-than-expected consumer confidence numbers and ongoing
concerns rate hikes are possible in the U.S. next year
The Commerce Department said new home
sales fell by the most in five months in February, indicating
headwinds still face the housing sector.
Fed Chair Janet Yellen suggested that
interest rates could rise six months after the Fed’s bond-buying
program ends.
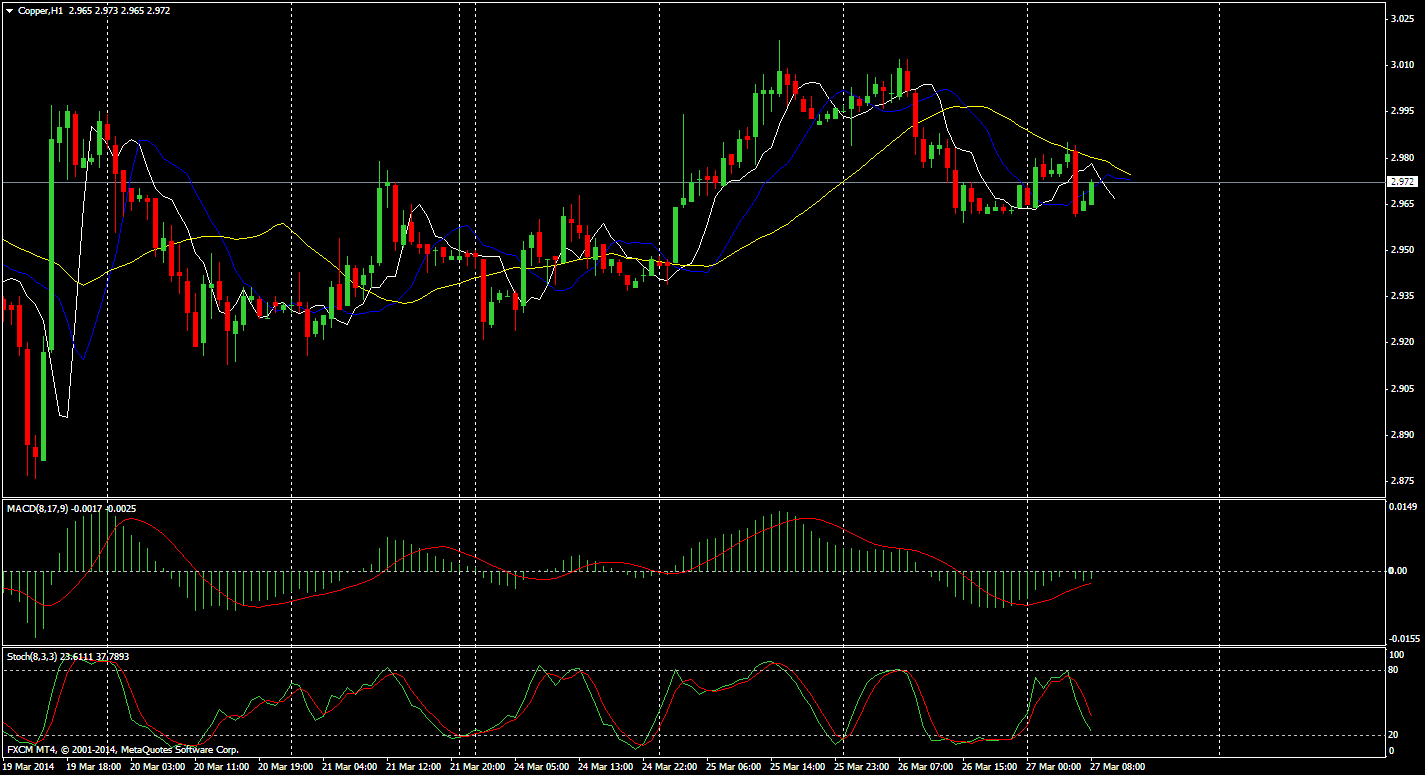
COPPER
On the Comex division of the New York
Mercantile Exchange, copper futures for May delivery rose to a
session high of $2.994 a pound, the most since March 20.
Copper last traded at $2.979 a pound
during European morning hours, up 1.15%, or 3.4 cents.

Prices lost 0.17%, or 0.5 cents on
Monday to settle at 2.945 a pound. Futures were likely to find
support at $2.921 a pound, the low from March 24 and resistance at
$2.997 a pound, the high from March 19.
Data released on Monday showed that
Chinese manufacturing activity deteriorated for a third successive
month in March.
The weaker than expected data fuelled
hopes Beijing will unveil fresh stimulus measures to combat slowing
growth.
The industrial metal fell to $2.877 a
pound on March 19, the lowest since July 2010, amid growing concerns
over the health of China’s economy.
The Asian nation is the world’s
largest copper consumer, accounting for almost 40% of world
consumption last year.
Elsewhere on the Comex, gold for June
delivery inched up 0.32%, or $4.20, to trade at $1,315.30 a troy
ounce, while silver for May delivery added 0.35%, or 7.1 cents, to
trade at $20.13 an ounce.
Investors looked ahead to key U.S.
economic data later in the day for further indications on the
strength of the economy and the future course of monetary policy.
The U.S. is to release report on house
price inflation and consumer confidence, as well as official data on
new home sales later Tuesday.
Copper prices rallied more than 1% on
Tuesday, amid growing hopes that China will unveil fresh stimulus
measures to boost slowing economic growth.
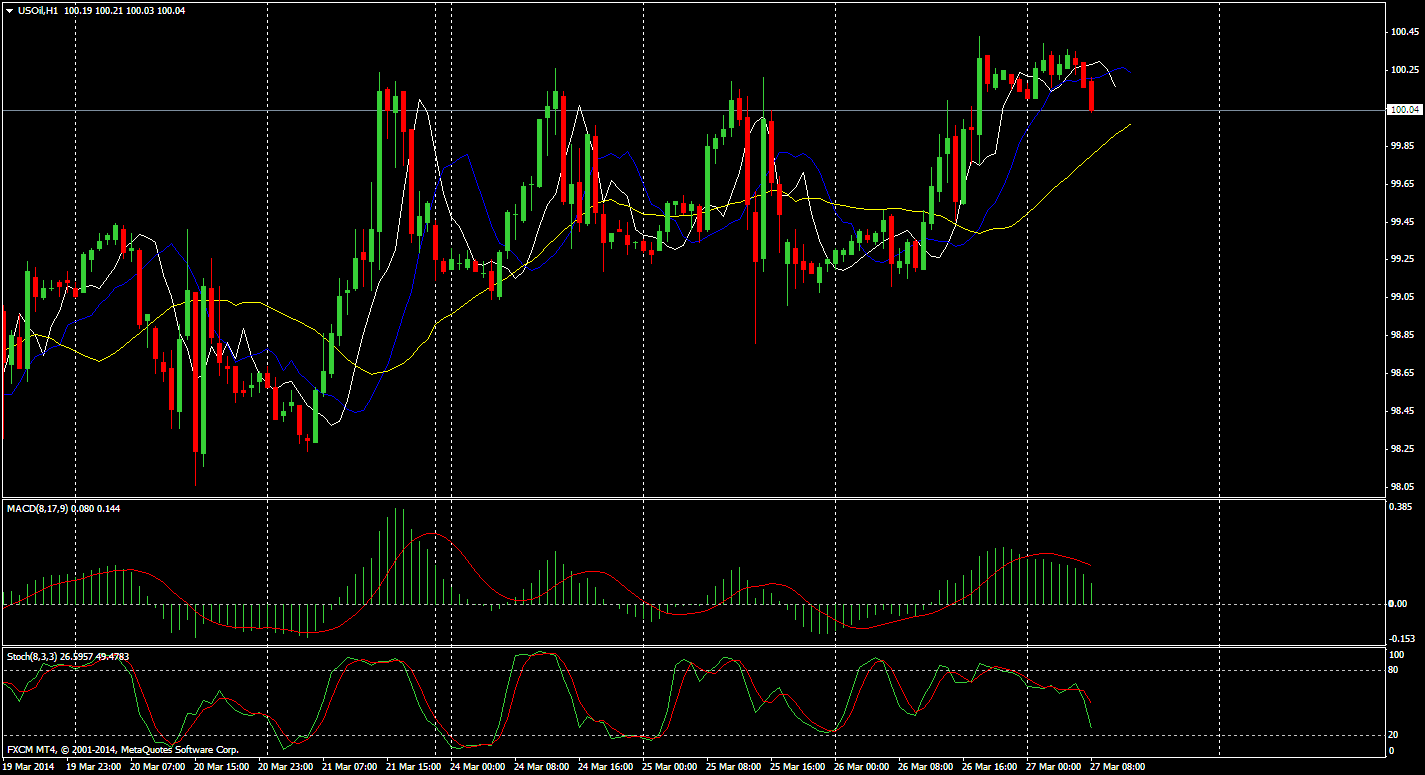
CRUDE
On the New York Mercantile Exchange,
West Texas Intermediate crude oil for delivery in May traded at
$99.31, up 0.10%, after hitting an overnight session low of $98.82 a
barrel and a high of $100.22 a barrel.

Brent crude for May delivery, which
gauges global oil prices, rose 18 cents, or 0.2%, to $106.99 a barrel
on the ICE Futures Europe exchange on Tuesday.
Industry trade group the American
Petroleum Institute said domestic crude stockpiles rose 6.3 million
barrels last week, while gasoline stocks declined 2.8 million
barrels, distillate stocks rose 0.3 million barrels and refinery runs
were 86.8% of capacity.
The U.S. Department of Energy will
release its own estimates on Wednesday.
Overnight, crude futures fell as
investors remained spooked over soft Chinese output data released
during the weekend, largely shrugging off robust U.S. consumer
confidence data.
Crude falls on China output data, looks
past U.S. confidence report
Soft Chinese factory data released over
the weekend continued to water down oil prices on Tuesday.
China’s HSBC Flash Purchasing
Managers Index, the earliest indicator of the country's industrial
activity, fell to an eight-month low of 48.1 in March from a final
reading of 48.5 in February, defying expectations for a rise to 48.7.
Crude oil prices rose slightly in Asia
on Wednesday on continued geopolitical tensions over the Ukraine, but
ample U.S. industry inventory data tempered gains.
Technical Levels
|
SUPPORT 1 |
SUPPORT 2 |
RESISTANCE 1 |
RESISTANCE 2 |
| GOLD |
1305 |
1299 |
1317.6 |
1324 |
| SILVER |
19.90 |
19.73 |
20.17 |
20.42 |
| COPPER |
2.0041 |
2.9628 |
3.0751 |
3.1048 |
| CRUDE
|
98.57 |
97.96 |
100.02 |
100.86 |
Global Economic Data
| TIME :IST
|
DATA |
PRV |
EXP |
IMPACT |
| 6.00P.M
|
Core Durable Goods Orders m/m |
1.1% |
0.3% |
STRONG |
| 6.00P.M
|
Durable Goods Orders m/m |
-1.0%
|
1.1% |
MEDIUM |
| 8.00P.M
|
Crude Oil Inventories |
5.9M |
2.9M |
MEDIUM |
Core Durable Goods Orders m/m
| Source |
Census Bureau (latest release) |
| Measures |
Change in the total value of new purchase orders placed with
manufacturers for durable goods, excluding transportation items; |
| Usual Effect |
Actual > Forecast = Good for currency; |
| Frequency |
Released monthly, about 26 days after the month ends; |
| Next Release |
Apr 24, 2014 |
| FF Notes |
Orders for aircraft are volatile and can severely distort the
underlying trend. The Core data is therefore thought to be a
better gauge of purchase order trends; |
Why Traders
Care |
It's a leading indicator of production - rising purchase orders
signal that manufacturers will increase activity as they work to
fill the orders; |
| Also Called |
Durable Goods Orders Ex Transportation; |
| Source |
Census Bureau (latest release) |
Durable Goods Orders m/m
| Source |
Census Bureau (latest release) |
| Measures |
Change in the total value of new purchase orders placed with
manufacturers for durable goods; |
| Usual Effect |
Actual > Forecast = Good for currency; |
| Frequency |
Released monthly, about 26 days after the month ends; |
| Next Release |
Apr 24, 2014 |
| FF Notes |
This data is usually revised via the Factory Orders report
released about a week later. Durable goods are defined as hard
products having a life expectancy of more than 3 years, such as
automobiles, computers, appliances, and airplanes; |
Why Traders
Care |
It's a leading indicator of production - rising purchase orders
signal that manufacturers will increase activity as they work to
fill the orders; |
Crude Oil Inventories
| Source |
Energy Information Administration (latest release) |
| Measures |
Change in the number of barrels of crude oil held in inventory
by commercial firms during the past week; |
| Usual Effect |
No consistent effect - there are both inflationary and growth
implications; |
| Frequency |
Released weekly, 4 days after the week ends; |
| Next Release |
Apr 2, 2014 |
| FF Notes |
While this is a US indicator, it most affects the loonie due to
Canada's sizable energy sector; |
Why Traders
Care |
It influences the price of petroleum products which affects
inflation, but also impacts growth as many industries rely on oil
to produce goods; |
| Also Called |
Crude Stocks, Crude Levels; |
| Acro Expand |
Energy Information Administration (EIA); |