GOLD
Gold
edged lower overnight to open at 1335.50/1336.50. It fell briefly to a
low of 1333.50/1334.50 as U.S. equities opened at an all-time high after
China’s Yuan depreciated to its lowest level in over three years. The
metal then advanced to a high of 1343.00/1344.00 after disappointing
U.S. data pointed to low consumer confidence that raised concerns about
economic recovery; this coupled with worries about China’s economic
slowdown and political crisis in emerging markets. It closed the day at
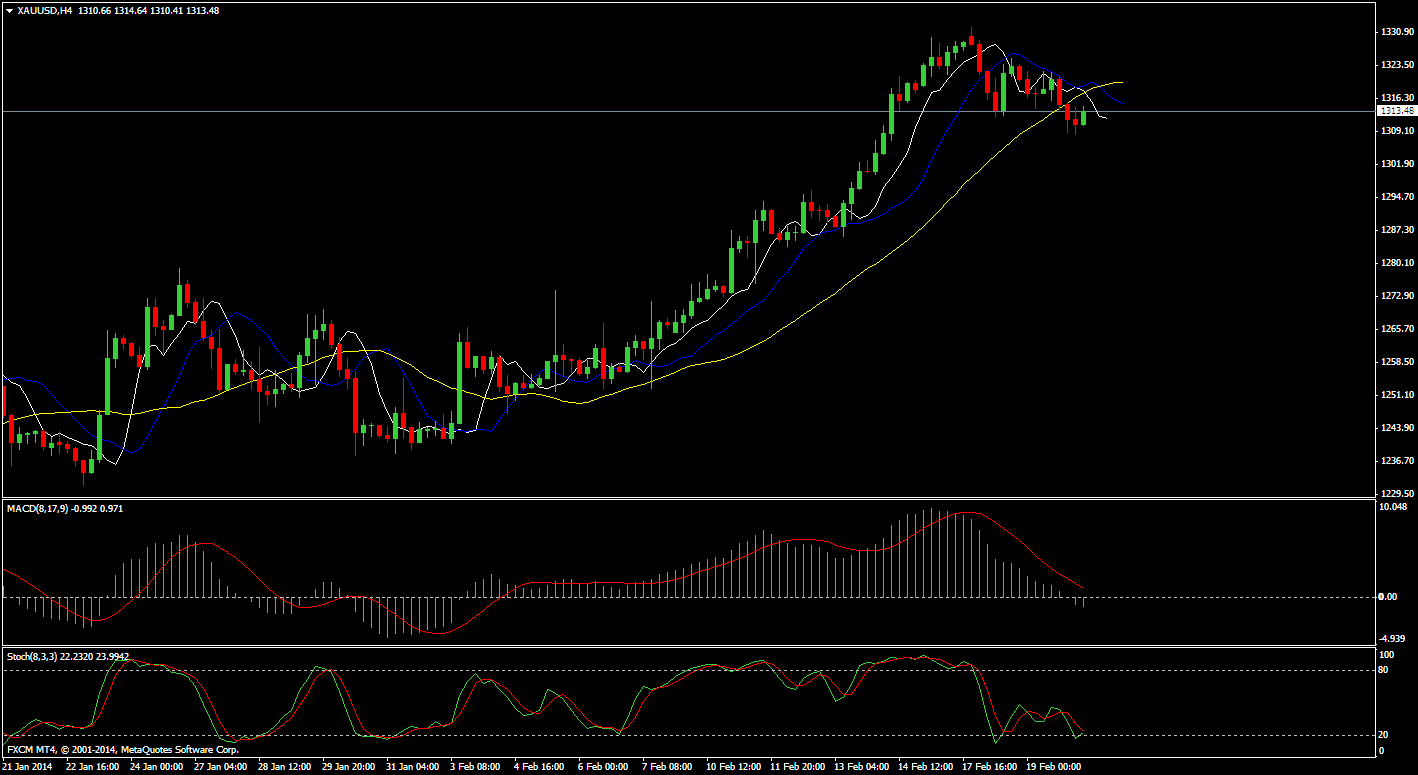
1342.00/1343.00. Gold
closed higher today at 1343, taking out another Fibonacci resistance
level at 1337. As was also noted yesterday, there is some small RSI
divergence, however RSI is still moving higher at the current 73.52
level. We would want to see it take out the previous high of 75.57. In
price, there are previous highs in the 1362 and 1375 areas, but we see
the risk as a full retracement back to the 1433 high from August 2013.
Only a move back below 1308 would change this view.
Gold
gained after disappointing U.S. consumer confidence and a lackluster
gain in home prices fueled concerns over the pace of U.S. economic
recovery.
U.S.
home price gains slowed in December, according to a closely watched
housing survey that underscored a loss of momentum in the housing
recovery
Gold
holdings at Turkey’s central bank fell by a hefty 31.171 tonnes in
January, data from the International Monetary Fund showed.
Gold
closed higher today at 1343, taking out another Fibonacci resistance
level at 1337. As was also noted yesterday, there is some small RSI
divergence, however RSI is still moving higher at the current 73.52
level. We would want to see it take out the previous high of 75.57. In
price, there are previous highs in the 1362 and 1375 areas, but we see
the risk as a full retracement back to the 1433 high from August 2013.
Only a move back below 1308 would change this view.
Gold
gained after disappointing U.S. consumer confidence and a lackluster
gain in home prices fueled concerns over the pace of U.S. economic
recovery.
U.S.
home price gains slowed in December, according to a closely watched
housing survey that underscored a loss of momentum in the housing
recovery
Gold
holdings at Turkey’s central bank fell by a hefty 31.171 tonnes in
January, data from the International Monetary Fund showed.
SILVER
 Gold
closed higher today at 1343, taking out another Fibonacci resistance
level at 1337. As was also noted yesterday, there is some small RSI
divergence, however RSI is still moving higher at the current 73.52
level. We would want to see it take out the previous high of 75.57. In
price, there are previous highs in the 1362 and 1375 areas, but we see
the risk as a full retracement back to the 1433 high from August 2013.
Only a move back below 1308 would change this view.
Gold
gained after disappointing U.S. consumer confidence and a lackluster
gain in home prices fueled concerns over the pace of U.S. economic
recovery.
U.S.
home price gains slowed in December, according to a closely watched
housing survey that underscored a loss of momentum in the housing
recovery
Gold
holdings at Turkey’s central bank fell by a hefty 31.171 tonnes in
January, data from the International Monetary Fund showed.
Gold
closed higher today at 1343, taking out another Fibonacci resistance
level at 1337. As was also noted yesterday, there is some small RSI
divergence, however RSI is still moving higher at the current 73.52
level. We would want to see it take out the previous high of 75.57. In
price, there are previous highs in the 1362 and 1375 areas, but we see
the risk as a full retracement back to the 1433 high from August 2013.
Only a move back below 1308 would change this view.
Gold
gained after disappointing U.S. consumer confidence and a lackluster
gain in home prices fueled concerns over the pace of U.S. economic
recovery.
U.S.
home price gains slowed in December, according to a closely watched
housing survey that underscored a loss of momentum in the housing
recovery
Gold
holdings at Turkey’s central bank fell by a hefty 31.171 tonnes in
January, data from the International Monetary Fund showed.SILVER
Silver
retreated overnight to open at 21.82/21.87. It dropped to a low of
21.73/21.78 before recovering to post a high of 22.00/22.05. It
concluded the session at 21.96/22.01.
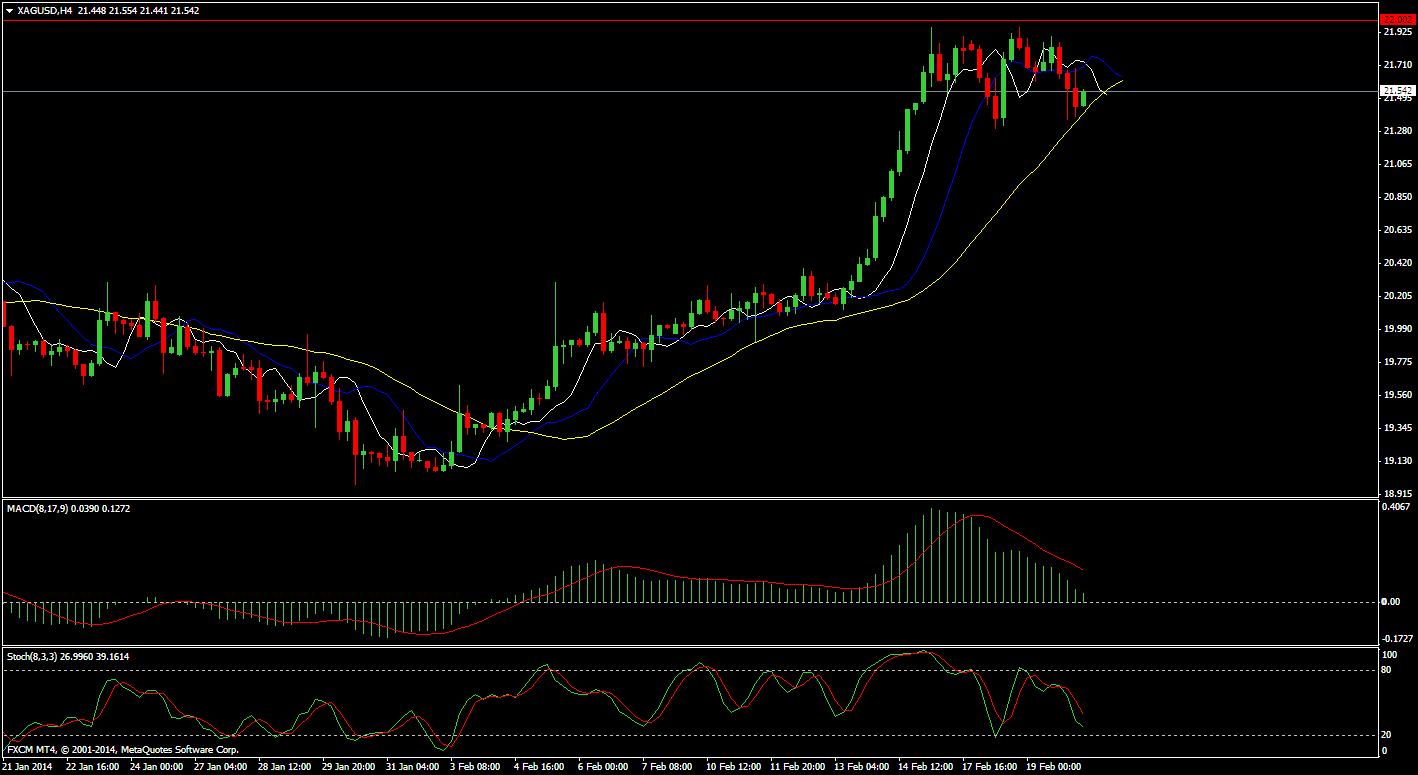
Silver
closed unchanged today at 21.96. The metal has been trading sideways
for the past seven sessions. It has been unable to close above
resistance in the 21.97 area, which is the 50% retracement of the August
to December downtrend. We remain bullish so long as the metal holds the
38.2% retracement level at 21.23. The next target is 22.71, the 61.8%
retracement level.
 The
gold-silver ratio is higher today at current 61.12, but has traded
sideways for the past week. Having broken the uptrend last week, we
still see the risk as a full retracement to the 57.09 low.
Silver prices ended with losses as pressure seen tracking weakness in crude oil and base metals prices.
The
S&P/Case-Shiller 20-city HPI showed U.S. home price gains slowed in
December, underscoring a loss of momentum in the housing recovery
A spate of soft economic data from the United States and China since the start of the year has drawn investors back to bullion.
The
gold-silver ratio is higher today at current 61.12, but has traded
sideways for the past week. Having broken the uptrend last week, we
still see the risk as a full retracement to the 57.09 low.
Silver prices ended with losses as pressure seen tracking weakness in crude oil and base metals prices.
The
S&P/Case-Shiller 20-city HPI showed U.S. home price gains slowed in
December, underscoring a loss of momentum in the housing recovery
A spate of soft economic data from the United States and China since the start of the year has drawn investors back to bullion.
COPPER
A
cooler property sector not only weighs on demand for copper as
construction material, but also dampens consumption from the home
appliances sector.
The Asian nation is the world’s largest copper consumer, accounting for almost 40% of world consumption last year.
 On
the Comex division of the New York Mercantile Exchange, copper futures
for May delivery traded in a range between $3.215 a pound and $3.253 a
pound.
Coppe prices last traded at $3.218 a pound during European morning hours, down 0.65%.
The
May copper contract fell to $3.204 a pound on Monday, the lowest since
February 11, before trimming losses to settle at $3.240 a pound, down
0.61%.
Futures
were likely to find support at $3.204 a pound, the low from February 24
and resistance at $3.259 a pound, the high from February 24.
Data
released Monday showed that average new home prices in China’s 70 major
cities rose 9.6% in January from a year earlier, easing from the
previous month’s 9.9% increase.
It was the first slowdown in the rate of price increases since November 2012.
Meanwhile,
market players also looked ahead to key U.S. economic data later in the
day for further indications on the strength of the economy and the
future course of monetary policy.
The U.S. is to release a closely-watched report on consumer confidence, as well as private sector data on house price inflation.
The U.S. is second behind China in global copper demand.
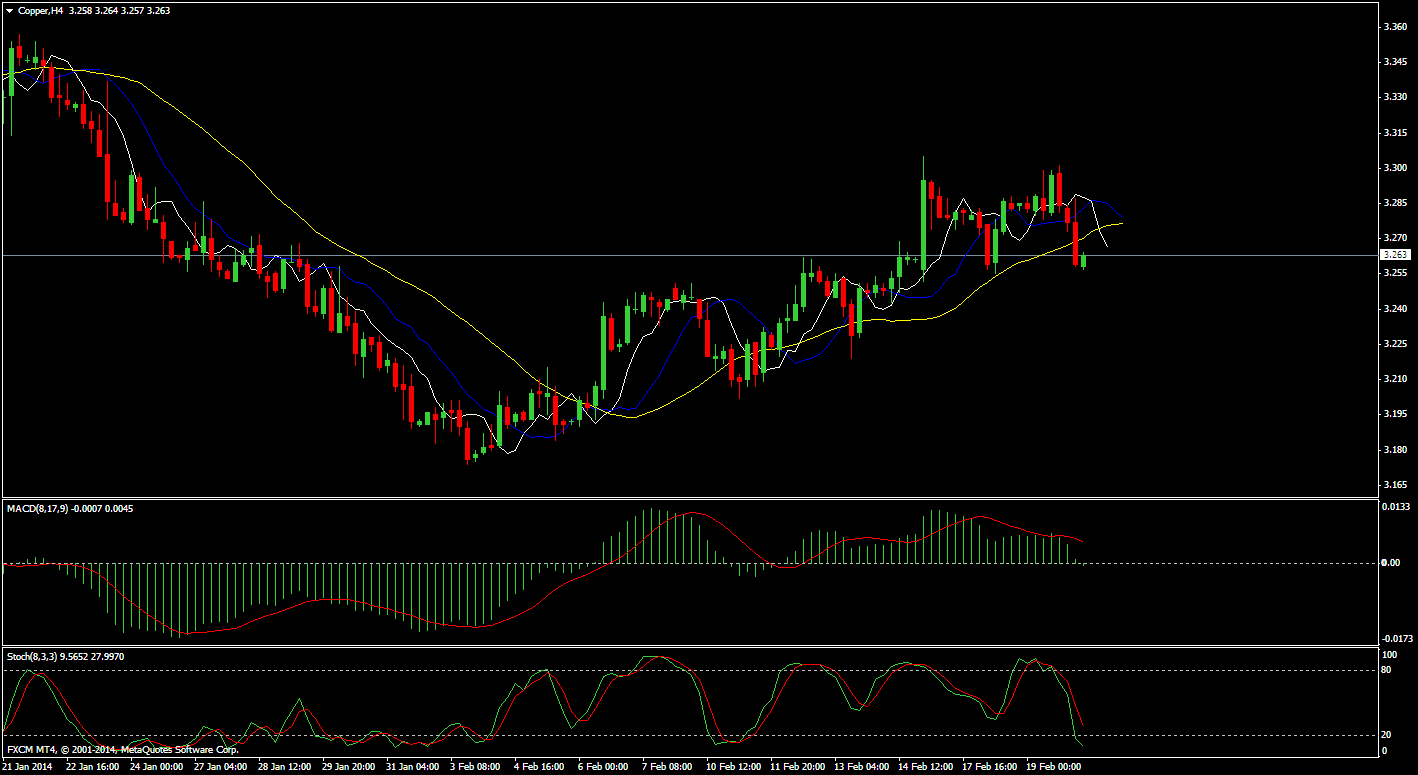
Copper
futures declined on Tuesday to re-approach the previous session’s
two-week low, amid ongoing concerns that attempts by policymakers in
Beijing to cool China’s property sector and rein in lending will reduce
demand for the industrial metal.
On
the Comex division of the New York Mercantile Exchange, copper futures
for May delivery traded in a range between $3.215 a pound and $3.253 a
pound.
Coppe prices last traded at $3.218 a pound during European morning hours, down 0.65%.
The
May copper contract fell to $3.204 a pound on Monday, the lowest since
February 11, before trimming losses to settle at $3.240 a pound, down
0.61%.
Futures
were likely to find support at $3.204 a pound, the low from February 24
and resistance at $3.259 a pound, the high from February 24.
Data
released Monday showed that average new home prices in China’s 70 major
cities rose 9.6% in January from a year earlier, easing from the
previous month’s 9.9% increase.
It was the first slowdown in the rate of price increases since November 2012.
Meanwhile,
market players also looked ahead to key U.S. economic data later in the
day for further indications on the strength of the economy and the
future course of monetary policy.
The U.S. is to release a closely-watched report on consumer confidence, as well as private sector data on house price inflation.
The U.S. is second behind China in global copper demand.
Copper
futures declined on Tuesday to re-approach the previous session’s
two-week low, amid ongoing concerns that attempts by policymakers in
Beijing to cool China’s property sector and rein in lending will reduce
demand for the industrial metal.
CRUDE
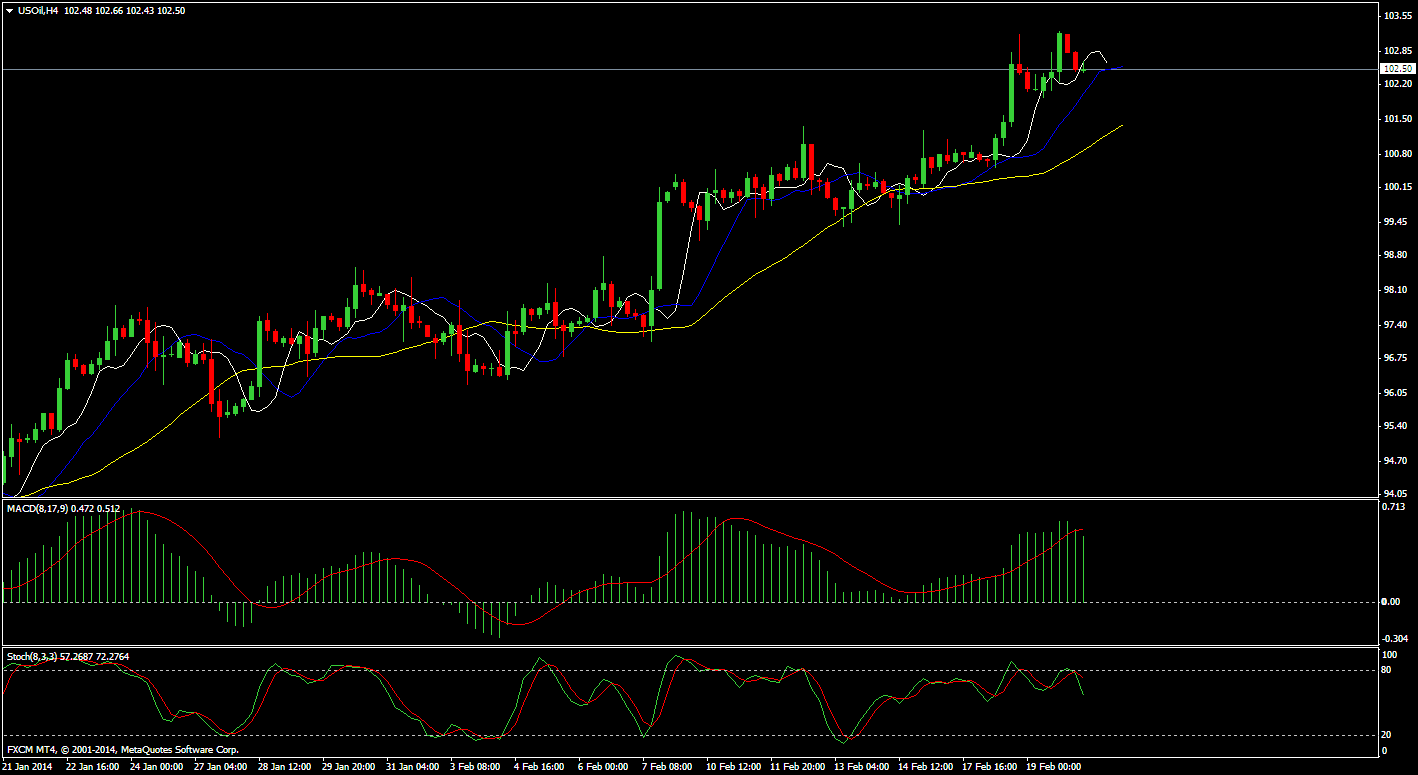
On
the New York Mercantile Exchange, West Texas Intermediate crude for
delivery in April traded at $102.05 a barrel during Asian trading, up
0.05%.
On
Tuesday the New York-traded oil futures hit a session low of $101.95 a
barrel and a high of $102.09 a barrel and settled at $101.99 a barrel.
 Nymex oil futures were likely to find support at $99.41 a barrel, the low
from Feb. 14, and resistance at $103.45 a barrel, Monday’s high.
Oil
prices slid after the Conference Board reported that its consumer
confidence index slipped to 78.1 in February from 79.4 in January,
mainly due to concerns over general business conditions, jobs, and
earnings.
Analysts were expecting the index to tick up to 80.0.
The
present situation index rose to its highest level in almost six years,
but the expectations index declined, indicating that while consumers
believe the economy has improved they do not foresee further
considerable improvement in the coming months.
Giving
oil some support were expectations the Federal Reserve will very
gradually taper its $65 billion monthly bond-buying program, which
weakens the dollar by suppressing long-term borrowing costs to spur
recovery.
Nymex
crude oil prices were mixed between small gains and losses during Asian
trade on Wednesday after a sustained decline overnight as the markets
anticipated that a sluggish U.S. economy will demand less fuel and
energy, while warmer weather forecasts too pushed prices lower.
Nymex oil futures were likely to find support at $99.41 a barrel, the low
from Feb. 14, and resistance at $103.45 a barrel, Monday’s high.
Oil
prices slid after the Conference Board reported that its consumer
confidence index slipped to 78.1 in February from 79.4 in January,
mainly due to concerns over general business conditions, jobs, and
earnings.
Analysts were expecting the index to tick up to 80.0.
The
present situation index rose to its highest level in almost six years,
but the expectations index declined, indicating that while consumers
believe the economy has improved they do not foresee further
considerable improvement in the coming months.
Giving
oil some support were expectations the Federal Reserve will very
gradually taper its $65 billion monthly bond-buying program, which
weakens the dollar by suppressing long-term borrowing costs to spur
recovery.
Nymex
crude oil prices were mixed between small gains and losses during Asian
trade on Wednesday after a sustained decline overnight as the markets
anticipated that a sluggish U.S. economy will demand less fuel and
energy, while warmer weather forecasts too pushed prices lower.
Technical Levels
| SUPPORT 1 | SUPPORT 2 | RESISTANCE 1 | RESISTANCE 2 | |
| GOLD | 1336 | 1329 | 1347 | 1357 |
| SILVER | 21.74 | 21.53 | 22.10 | 22.45 |
| COPPER | 3.2335 | 3.2085 | 3.2845 | 3.3105 |
| CRUDE | 100.95 | 100.07 | 102.77 | 103.77 |
| TIME :IST | DATA | PRV | EXP | IMPACT |
| 8.30P.M | New Home Sales | 414K | 406K | STRONG |
| 9.00P.M | Crude Oil Inventories | 1.0M | 1.1M | MEDIUM |
| Source | Census Bureau(latest release) |
| Measures | Annualized number of new single-family homes that were sold during the previous month; |
| Usual Effect | Actual > Forecast = Good for currency; |
| Frequency | Released monthly, about 25 days after the month ends; |
| Next Release | Mar 25, 2014 |
| FF Notes | While this is monthly data, it’s reported in an annualized format (monthly figure x12); |
| Why Traders Care |
It’s a leading indicator of economic health because the sale of a new home triggers a wide-reaching ripple effect. For example, furniture and appliances are purchased for the home, a mortgage is sold by the financing bank, and brokers are paid to execute the transaction; |
| Also Called | New Residential Sales; |
| Source | Energy Information Administration (latest release) |
| Measures | Change in the number of barrels of crude oil held in inventory by commercial firms during the past week; |
| Usual Effect | No consistent effect – there are both inflationary and growth implications; |
| Frequency | Released weekly, 4 days after the week ends; |
| Next Release | Mar 5, 2014 |
| FF Notes | While this is a US indicator, it most affects the loonie due to Canada’s sizable energy sector; |
| Why Traders Care |
It influences the price of petroleum products which affects inflation, but also impacts growth as many industries rely on oil to produce goods; |
| Also Called | Crude Stocks, Crude Levels; |