Social Icons

Pages

Tuesday, December 17, 2013

Singapore SGX: Technical View on STI

Market Review:
Singapore Equities opened with good gap and closed higher than previous days close.
Singapore shares open above resistance level of 3065 @ 3073.07 and then it made day high @ 3077.71 and traded whole day above opening level but end of the day it fell below this mark and closed @ 3067.57 after making day low 3063.38 with gain of 13.80 points down by 0.45%.
Some 2.53 billion shares, valued at S$791.4 million were traded. Gainers numbered 222 while losers numbered 157.
STRAITS TIME LEVELS
Support 1
3040
Support 2
3015
Support 3
2990
Resistance 1
3075
Resistance 2
3095
Resistance 3
3120
Market forecast:
STI again traded in very narrow range but closed with gait opened with good gap. as investors are cautious about upcoming FED meeting.
STI again formed a small candlestick as it was very narrow range trading, but the positive thing is STI closed above resistance level of 3065.
As per the technical outlook of STI, currently it is in bearish trend and also crossed its major support zone 3065. So for further improvement in trend STI need to maintain it self above 3165 mark.
Image
Support:
STI having immediate support @ 3040 level and below this level it can take support @3015-2990 will be the support zone for STI.
Resistance:
STI having immediate Resistance @3075 and above this level it may take resistance @ 3095-3120

Technical indicators:
Technical indicators MACD, RSI and CCI are turning lower.

Gold Silver Copper Crude: Commodity Technical Outlook

Technical Levels

SUPPORT 1 SUPPORT 2 RESISTANCE 1 RESISTANCE 2
GOLD 1232 1219 1254 1263
SILVER 19.60 19.15 20.34 20.64
COPPER 3.3620 3.3480 3.3835 3.3910
CRUDE 96.56 95.64 98.04 98.60
Commodity Contract S3 S2 S1 R1 R2 R3
GOLD
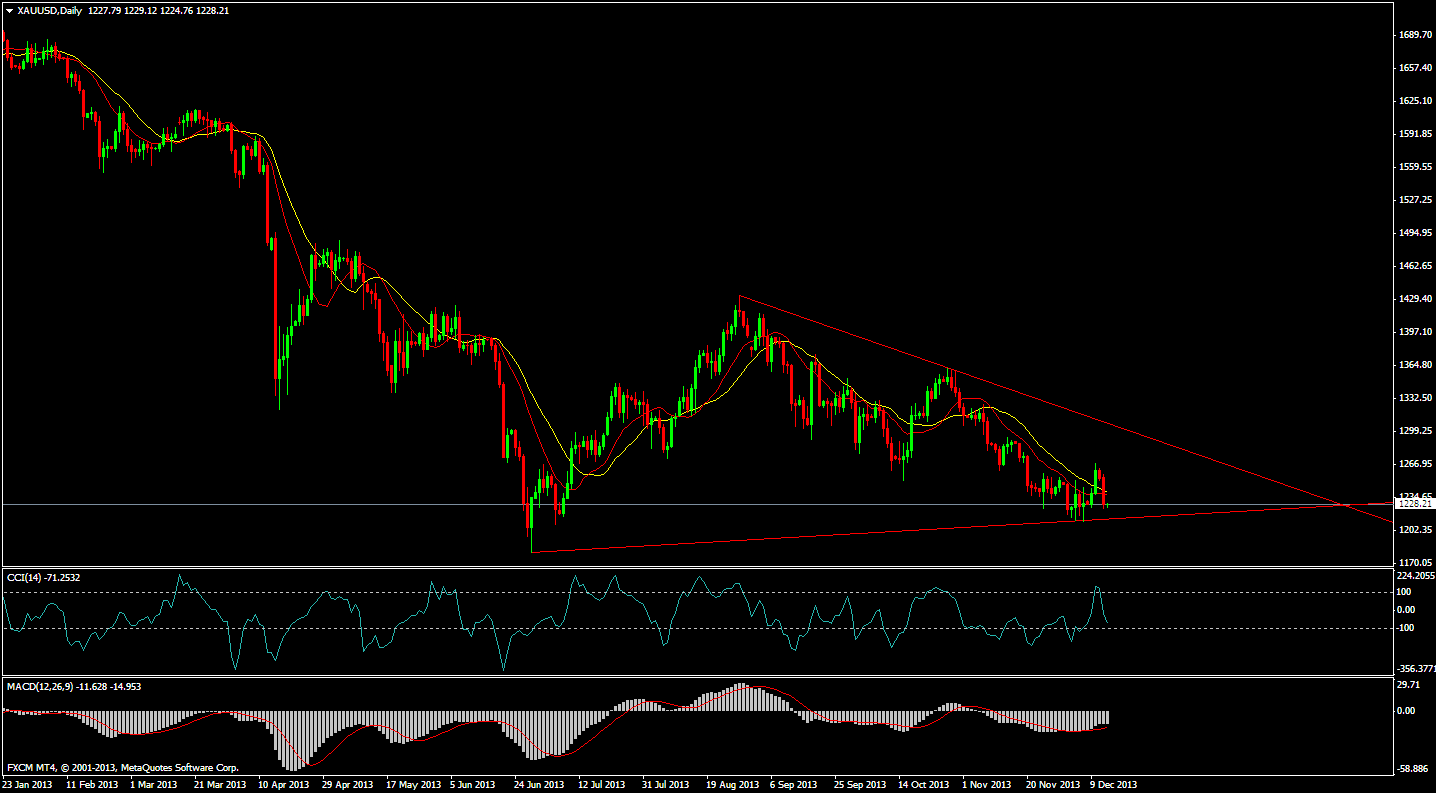
Gold moved higher overnight to open at 1236.00/1237.00. It  touched a low of 1233.00/1234.00 following better-than-expected  U.S. manufacturing data. The metal then surged to a high of  1251.50/1252.50 on dollar weakness and gains in crude oil, which  led to short-covering ahead of the FOMC meeting starting  tomorrow. The metal came under selling pressure later in the  afternoon to finally close at 1244.50/1245.50.
Gold made a small gain today, closing at 1244, but the last two  sessions have still traded within Thursday’s range. The metal has  essentially traded sideways since November 21st, within a 1210  (support) and 1268 (resistance) range. The trend remains bearish,  and well away from ‘oversold’ levels.               
Gold ended lower as investors nervously eyed Fed’s last policy meeting to gauge whether the central bank would stick to its monetary stimulus.
Fed policymakers gather for the last time in 2013 for a two-day policy meeting that concludes on Wednesday.
SPDR Gold Trust said its holdings fell 8.70 tonnes to 818.90 tonnes – its biggest outflow since Oct 21.

SILVER
Silver moved higher overnight to open at 19.63/19.68. It dipped to  a low of 19.61/19.66 and then followed gold to a high of  20.28/20.33 prior to concluding the session at 20.11/20.16.
Silver closed higher at 20.11, but as with gold, the range remains  within the range of Thursday’s selloff. Support is at Friday’s low of  19.30, and resistance is at the recent 20.51 high. A break upwards  through 20.51 would stabilize silver.
Gold-silver ratio traded lower today at current 62.07. Support is at  the recent low of 61.50, with resistance at the 64.26 high from  December 4th. We remain bullish the ratio.
Silver gained as investors determined the Federal Reserve may hold off on tapering its USD85 billion in monthly asset purchases until early 2014.
Prices could come under further pressure if Fed decides to taper its $85 billion monthly bond purchases.
Holdings at ishares silver trust dropped by 23.96 tonnes to 10139.78 tonnes from 10163.74 tonnes.

COPPER

On the Comex division of the New York Mercantile Exchange, copper futures for March delivery traded at USD3.321 a pound during European morning trade, up 0.3%. Comex copper prices climbed to a session high of USD3.325 a pound earlier, the strongest level since November 1.
Copper prices were likely to find support at USD3.256 a pound, the low from December 11 and resistance at USD3.325 a pound, the high from November 1.
The March contract settled 0.5% higher on Friday to end at USD3.312 a pound.
Data released earlier showed that manufacturing activity in the euro zone expanded at the fastest pace since May 2011 in December.
Market research group Markit said that its preliminary manufacturing purchasing managers’ index inched up to a seasonally adjusted 52.7 this month from a final reading of 51.6 in November. Analysts had expected the index to inch up to 51.9 this month.
Copper futures rose to a six-week high on Monday, following the release of upbeat euro zone manufacturing data, while investors eyed the Federal Reserve's upcoming policy meeting this week.
Copper dropped but downside was limited after release of upbeat euro zone manufacturing data.
Data released earlier showed that manufacturing activity in the euro zone expanded at the fastest pace since May 2011 in December.
Market research group Markit said that its preliminary manufacturing purchasing managers’ index inched up to a seasonally adjusted 52.7 this month.

CRUDE
On the New York Mercantile Exchange, light sweet crude futures for delivery in February traded at USD97.54 a barrel, down 0.01%, after hitting a session low of USD96.53 and a high of USD97.92.
ICE Futures Exchange Brent crude for January delivery, which expired at the end of the trading session, rose 1.5% to USD110.47 a barrel, posting its highest settlement since Dec. 6. The more actively traded February contract added 1% to USD109.41 a barrel.
London-based market research group Markit reported earlier that its preliminary U.S. manufacturing purchasing managers’ index declined to a seasonally adjusted 54.4 in December from a final reading of 54.7 in November.
Analysts were expecting the index to rise to 54.9 this month.
The Federal Reserve Bank of New York reported earlier that its Empire State manufacturing index came in at 0.98 in December compared to November's -2.21 reading, though analysts were expecting the index to rise to 4.75.
Crude oil prices traded flat in Asia Tuesday with investors squarely focused on the Federal Reserve after spotty U.S. economic indicators rekindled expectations that the Federal Reserve could hold off on tapering its USD85 billion in monthly asset purchases at a policy meeting this week and wait until early next year.
Crude oil recovered losses boosted by expectations for rising demand from positive European economic data, while supplies from Libya remained sharply curtailed.
The closure of key Libyan oil ports is preventing the export of several hundred thousand bpd of high quality, light crude
China’s November crude oil output inched up 0.36 percent from a year ago to 17.27 million tones.

Global Economic Data
TIME DATA PRV EXP IMPACT
7.00P.M Core CPI m/m 0.1% 0.1% STRONG
7.00P.M CPI m/m -0.1% 0.1% MEDIUM
8.30P.M NAHB Housing Market Index 54 55 MEDIUM
Core CPI m/m
Source Bureau of Labor Statistics (latest release)
Measures Change in the price of goods and services purchased by consumers, excluding food and energy;
Usual Effect Actual > Forecast = Good for currency;
Frequency Released monthly, about 15 days after the month ends;
Next Release Jan 16, 2014
FF Notes Food and energy prices account for about a quarter of CPI, but they tend to be very volatile and distort the underlying trend. The FOMC usually pays the most attention to the Core data - so do traders;
Why Traders
Care
Consumer prices account for a majority of overall inflation. Inflation is important to currency valuation because rising prices lead the central bank to raise interest rates out of respect for their inflation containment mandate;
Also Called CPI Ex Food and Energy, Underlying CPI;
Acro Expand Consumer Price Index (CPI), Federal Open Market Committee (FOMC);
CPI m/m
Source Bureau of Labor Statistics (latest release)
Measures Change in the price of goods and services purchased by consumers;
Usual Effect Actual > Forecast = Good for currency;
Frequency Released monthly, about 15 days after the month ends;
Next Release Jan 16, 2014
Why Traders
Care
Consumer prices account for a majority of overall inflation. Inflation is important to currency valuation because rising prices lead the central bank to raise interest rates out of respect for their inflation containment mandate;
Derived Via The average price of various goods and services are sampled and then compared to the previous sampling;
Acro Expand Consumer Price Index (CPI);
NAHB Housing Market Index
Source NAHB (latest release)
Measures Level of a diffusion index based on surveyed home builders;
Usual Effect Actual > Forecast = Good for currency;
Frequency Released monthly, around the middle of the current month;
Next Release Jan 16, 2014
FF Notes Above 50 indicates a favorable outlook on home sales, below indicates a negative outlook;
Derived Via Survey of about 900 home builders which asks respondents to rate the relative level of current and future single-family home sales;

Friday, December 13, 2013

GOLD SILVER COPER CRUDE: Overnight Commodity Technical Outlook

GOLD
Gold declined overnight to open at 1234.50/1235.50 after a  budget agreement reached by U.S. lawmakers was seen as a sign  of early tapering of the Fed’s monthly bond-buying program. The  metal briefly touched a high of 1236.50/1237.50 before declining  to an intra-day low of 1224.50/1225.50 following strong U.S. retail  sales data while the dollar strengthened despite an increase in U.S.  initial jobless claims. The metal consolidated later in the afternoon  to conclude the session at 1225.00/1226.00.
Gold closed lower for the second day today, closing at 1226.  Bearish momentum, which had been trending downward since  early September, has now bounced back higher, putting the  downside into more immediate focus. Resistance is at 1277, the  61.8% retracement of the June to August uptrend. Support is at  the recent low of 1210.
Gold fell as expectations grew that the Federal Reserve would reduce its huge stimulus programme after a provisional budget deal in Washington.
Imports into India have fallen sharply this year after the Indian government lifted import duty to 10 percent earlier this year.
This year has seen heavy liquidation of ETF holdings, with the SPDR’s holdings dropping by more than 500 tonnes to their lowest in nearly five years.
SILVER
Silver followed gold lower overnight to open at 19.75/19.80. It  touched a high of 19.78/19.83 and then quickly declining to a low  of 19.42/19.47 prior to concluding the session at 19.45/19.50.
Silver had a very bearish close, at 19.45. Resistance is at 20.85, the  61.8% retracement of the June to August uptrend. Support lies at  the recent low at 19.21.
The gold-silver ratio traded higher, to current 62.87, capping six  days of losses. Support is at 61.06, the 38.2% retracement of the  July–August range.
Silver fell after better-than-expected U.S. retail sales figures sparked market expectations for Fed to announce plans to taper its USD85 billion in monthly asset purchases.
U.S. retail sales rose solidly in November, another sign of a strengthening economy after last week’s better-than-expected U.S. nonfarm payrolls and GDP data
Holdings at ishares silver trust dropped by 44.92 tonnes to 10163.74 tonnes from 10208.66 tonnes.
COPPER
Copper settled up 1.19%  rose to the highest level in six weeks before trimming gains to trade little changed as investors looked ahead to key U.S. economic data later in the day to further gauge the strength of the economy and the need for stimulus. Economic indicators from the US turned out mixed Thursday, with retail sales beating forecast and initial jobless claims reported worse than expectation. Anticipation for a potential QE tapering in December continued to rise. Besides, as the ECB said it might maintain easing policies for a longer period of time, the euro fell back, helping with a $rebound and weighing commodities down. LME copper prices rose initially Thursday but with the increase blocked at $7,250/mt due to selling pressure, finally ending at $7,220/mt.
The mixed batch of U.S. economic data did little to alter expectations that the Federal Reserve will start to scale back its stimulus program next week.
Copper ended with gains as support seen from weakness in rupee and after data showed  US retail sales beating forecast.
A surplus in the global market for refined copper will widen by over 60 percent in 2014 as new mine supply outstrips reviving demand.
European Central Bank (ECB) said it might maintain easing policies for a longer period of time.
CRUDE
On the New York Mercantile Exchange, light sweet crude futures for delivery in January traded at USD97.41 a barrel, down 0.10%, after hitting an overnight session low of USD97.32 and a high of USD98.17.
The commodity shrugged off U.S. House approval Thursday of a two-year budget agreement drafted by House Budget Committee Chairman Paul Ryan and Senate Budget Committee Chairman Patty Murray and Senate Majority Leader Harry Reid indicated at a Thursday briefing that he expects the Senate to approve the package next week.
On Thursday, the Commerce Department reported earlier that U.S. retail sales rose 0.7% in November, beating market expectations for a 0.6% increase. Core retail sales, which are stripped of automobiles, rose 0.4%, above forecasts for a 0.2% increase.
Crude oil prices eased slightly in Asia on Friday in thin trade with the focus on whether the Federal Reserve will soon taper stimulus tools.
Crude oil rose after stronger-than-expected U.S. retail sales data boosted optimism over the health of the economy.
IEA said surging oil demand and faltering supplies mean oil prices face upside risks over the next few months.
Libyan Prime Minister Ali Zeidan said the government expected eastern tribes to reopen three oil ports over the weekend.

Technical Levels
SUPPORT 1 SUPPORT 2 RESISTANCE 1 RESISTANCE 2
GOLD 1216 1206 1245 1265
SILVER 19.11 18.82 19.88 20.55
COPPER 3.3115 3.3120 3.3420 3.3520
CRUDE 97.14 96.79 98.01 98.88
Commodity Contract S3 S2 S1 R1 R2 R3
Global Economic Data
DATE TIME DATA PRV EXP IMPACT
13.12.13 7.00P.M PPI m/m -0.2% 0.0% STRONG
13.12.13 7.00P.M Core PPI m/m 0.2% 0.1% MEDIUM
PPI m/m
Source Department of Labor (latest release)
Measures Change in the price of finished goods and services sold by producers;
Usual Effect Actual > Forecast = Good for currency;
Frequency Released monthly, about 17 days after the month ends;
Next Release Jan 15, 2014
FF Notes Tends to have more impact when it's released ahead of the CPI data because the reports are significantly correlated;
Why Traders
Care
It's a leading indicator of consumer inflation - when producers charge more for goods and services the higher costs are usually passed on to the consumer;
Also Called Finished Goods PPI. Wholesale Prices;
Acro Expand Producer Price Index (PPI);
Core PPI m/m
Source Department of Labor (latest release)
Measures Change in the price of finished goods and services sold by producers, excluding food and energy;
Usual Effect Actual > Forecast = Good for currency;
Frequency Released monthly, about 17 days after the month ends;
Next Release Jan 15, 2014
FF Notes Food and energy prices make up about 40% of overall PPI which tends to mute the importance of the Core data;
Also Called Core Finished Goods PPI;
Acro Expand Producer Price Index (PPI);
Source Department of Labor (latest release)

Wednesday, December 11, 2013

SINGAPORE SGX: Technical view on Straits Time Index (12 Dec)

Market Review:
Singapore Index extended losses for a 7th session, down 0.7% at their lowest close since September 2013.while most Asian share markets lurched lower as investors booked profits on a range of once-crowded positions, largely to the benefit of bonds and the detriment of the U.S. dollar.

Singapore shares open @ 3077.16 and then it made day high @ 3082.43 but can’t able to sustain this level and fell down badly crossed major support zone of 3065 and made day low @ 3056.55 also closed at 3060.74 with loss of 20.98 points down by 0.68%.
Some 1.43 billion shares, valued at S$1.06 billion were traded. Gainers numbered 106 while losers numbered 289.
STRAITS TIME LEVELS
Support 1
3040
Support 2
3015
Support 3
2990
Resistance 1
3095
Resistance 2
3120
Resistance 3
3140
 Market forecast:
STI trading below its 3 months lower levels and today it closed below support level of 3065 mark, which is bearish sign for market.
STI again formed a long black candlestick pattern which opens on day high or near to day high and closed at day low, all day bears were dominate bulls and finally win the battle for a day. This single candle is bearish in nature and shows more down trend in near future.
As per the technical outlook of STI, currently it is in bearish trend and also crossed its major support zone 3065. So for further improvement in trend STI need to maintain it self above 3165 mark.
Support:
STI having immediate support @ 3040 level and below this level it can take support @3015-2990 will be the support zone for STI.

Resistance:
STI having immediate Resistance @3095 and above this level it may take resistance @ 3120-3140

Technical indicators:
Technical indicators MACD, RSI and CCI are turning lower.